
Is the world becoming more peaceful? Recent decades have clearly been more peaceful than average. A number of people argue that this peaceful period is more than a temporary phenomenon and actually represents a consistent decline in war over the past two centuries. If so, we could reasonably expect that the recent peaceful period would continue and that wars might become even less frequent and less deadly.
Is the world becoming more peaceful? Recent decades have clearly been more peaceful than average. A number of people argue that this peaceful period is more than a temporary phenomenon and actually represents a consistent decline in war over the past two centuries. If so, we could reasonably expect that the recent peaceful period would continue and that wars might become even less frequent and less deadly. Unfortunately, these claims appear to overstate the available evidence, at least regarding interstate war. A reexamination of the available data on battle deaths in interstate war shows that while the last couple of decades have indeed been more peaceful than average, this peaceful period could easily be explained by chance.
The Decline of War Debate
Over the past decade, there has been significant debate over whether there is a long-term decline in war and armed conflict. Examining the number of war deaths since World War II, a number of scholars have concluded that war is indeed declining. Graphing battle deaths over time certainly seems to show that the past few decades have been less deadly than the early Cold War. The trend appears particularly striking when battle deaths are shown as a proportion of the overall population.
However, other scholars have challenged the conclusion that war is declining. For instance, political scientist Tanisha Fazal points out that improved medicine and health mean that a decline in battle deaths does not necessarily equate to a decline in violence, as wounded soldiers and civilians are more likely to survive. Others, such as political scientist Bear Braumoeller, have suggested that while the last few decades have been more peaceful than average, this apparent trend could simply be a result of random variation and may not necessarily represent a change in the probability of a war occurring.
A recent paper by Aaron Clauset, based on work he did for OEF Research and recently published in Science Advances, sets out to assess whether there is clear evidence of a changing probability of large interstate wars, or whether this apparent decline could be explained by random chance. Dishearteningly, Clauset finds that there is not yet sufficient evidence to conclude that there has been a meaningful decline in interstate war. As the deadliest wars occur relatively rarely, he assesses that we would need another 100 to 150 years without a major interstate war before we could conclude that large wars are becoming a thing of the past.
One potential drawback of Clauset’s analysis is that he does not account for population. One of the major arguments in favor of the decline of war is that even if wars have become deadlier in absolute terms, they may kill and wound a smaller proportion of the population. An individual’s chances of dying in war would be reduced, making the world an overall better place. In addition, as the global population expands, there are more political units that can fight, and these political groups have larger populations that they can mobilize. Thus, all else equal, we should expect that an expanding population would mean both more frequent and deadlier wars.
Reanalyzing the Prevalence of Interstate War
To extend Clauset’s analysis, I have reanalyzed the Correlates of War data to account for the overall population. Where Clauset looked at the total number of people killed in each interstate war, I examine the number killed as a proportion of the population of the interstate system. Given an increasing population, it is possible that the number of people killed as a proportion of the population could decrease, even if there were no decrease in absolute numbers. Unfortunately, I reach the same conclusion. There is little clear evidence of a decline in interstate conflict over the past two centuries. I present the main findings here. Interested readers can find more detail on the data, methods, and statistical results in the technical appendix below.
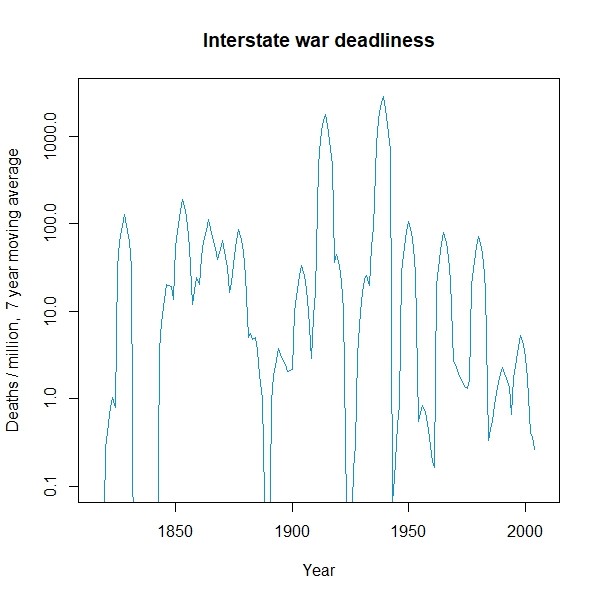
To begin, the graph above shows the number of battle deaths per million people (using a moving average, displayed on a logarithmic scale) for wars beginning in each year. Consistent with previous arguments, it does appear that the period since the mid-1980s was more peaceful than average. However, we can also see several other peaceful periods, such as during the Concert of Europe during the first half of the 1800s. Given this variability, it is difficult to see any clear trend.
To more formally analyze whether there might be a trend in war deaths hidden in the graph, I ran several statistical tests, which are described further in the technical appendix. Looking at the overall period, there is no evidence of a decline in interstate war. While it is possible that war has declined since 1945, this decline is matched by increases in earlier periods. Thus, while it is possible that the probability of dying in battle has changed over time, there is little statistical reason to believe that the recent decline will last.
Predicted war deaths show little evidence of decline
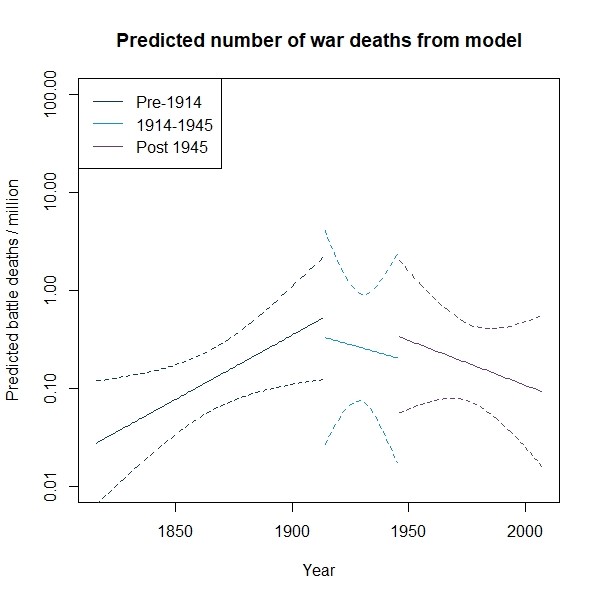
In the figure below, I plotted the predicted average number of battle deaths for three periods: that prior to World War I, the interwar period between 1914 and 1945 (including the World Wars), and the period following World War II. In essence, these are the lines that best fit the observed data, along with 95 percent confidence intervals for those predictions. While it is possible to see the decline in predicted battle deaths following the end of World War II, there is also a notable increase in battle deaths prior to World War I. In fact, the line is higher in 2007 than in 1816.
No clear changes in the probability of war
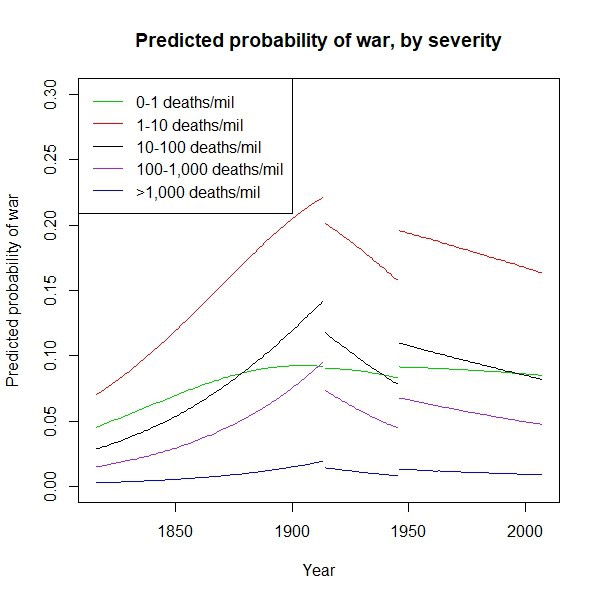
To check these results, I divided wars into five severity categories. I then used statistical techniques to estimate the probability that a war of a given severity would occur in a given year. While this analysis is similar to the previous results, it provides a slightly different view of the data. The results are consistent with the previous results. Over the entire period, there is no evidence of decline. Also, while there may be a decline since the end of the Second World War, this decline is again matched by increases in war deaths in previous periods. The figure below shows the predicted probability of a war in each severity category beginning in a given year from one of these models. While the probability of war in each category does appear to modestly decline in the period since World War II, the probability of war appears to increase over the nineteenth century. Also, again, the probability of war in each category is higher in 2007 than in 1816.
Conclusion
So, where does this leave us? I think we can conclude several things. First, the last two decades have indeed been more peaceful than average. There have been a number of periods where wars were more frequent and deadlier than in recent years. Popular perceptions that the world has gone “to hell in a handbasket” are simply incorrect, at least in terms of war.
On the other hand, the statistical record provides little, if any, evidence that this recent peaceful period represents a long-term decline in interstate war. While there may be some changes in the probability of war deaths, these changes appear to be either temporary or random variation around a flat base probability.
Despite this, I think there may be reasons to hope that the recent more peaceful period may continue. Like Clauset, I have only analyzed interstate conflict. Thus, a decline in civil war may be hiding in the data. In addition, the world is wealthier, more interconnected, and more democratic and has more international institutions than ever—all factors that scholars suggest may promote peace.
However, there are also reasons to be concerned. In particular the probable increase in geopolitical competition between China, Russia, and Western countries could easily reverse the peaceful period we have experienced. While we can be hopeful that the current trend towards fewer wars represents a lasting decline, there is little evidence to suggest that such a hopeful future is assured.
Technical Appendix
Above, I just provided an overview of my key findings. For interested readers, I will provide more detail here on exactly how I conducted my analysis. I will review the data and methods I used and then provide more detail on the technical results.
Data
Like Clauset, I draw my data on battle deaths from the Correlates of War (CoW) project. CoW has developed a list of every conflict between 1816 and 2007 that its coders believe incurred at least 1,000 battle deaths, which they have set as the cutoff to label a conflict a war. Each interstate war includes an estimate of the number of deaths that conflict caused. Unfortunately, data on the number of war casualties is notoriously unreliable. However, CoW almost certainly represents the best data with a long enough time span to detect a clear trend. The other prominent dataset of conflict, the UCDP/PRIO conflict data only goes back to 1945, which is not enough time to detect a reliable trend given the rarity of large wars. In addition, nearly the entire period since 1945 encompasses either the Cold War or US hegemony raising the possibility that any trend could be due to temporary systemic influences.
While I would like to include wars involving non-state actors, CoW is missing death data on a significant number of these wars, and coding rules to include a conflict in the war list may be slightly different than for interstate wars. Thus, I am limited to analyzing interstate wars.
As stated above, I am primarily interested in analyzing battle deaths relative to the overall population, to see whether an individual’s risk of dying in war has decreased. However, this creates a dilemma of what the relevant population is. For the entire 19th century and much of the 20th, large portions of the world were not part of the interstate system, and thus could not experience interstate war. CoW does not code wars of colonial conquest or control as interstate wars. Neither are wars between two non-state groups, such as various conflicts between the Zulu people and their neighbors, counted as interstate wars. Thus, in the 1800s much of the global population could not experience an interstate conflict. Using the entire global population would thus bias the results against detecting any decline in war and might even show an increase in conflict that was not really present.
Instead, I have used the combined population of all countries that CoW considers part of the interstate system. CoW considers a country a member of the interstate system if it meets two criteria. First, it must have a population of at least 500,000 people. Second, it must be recognized by other countries as member of the state system. Prior to 1920, this recognition is achieved if the country had exchanged diplomatic missions with Great Britain and France. After 1920, diplomatic recognition can be achieved either by exchanging diplomatic missions with two major powers or by becoming a member of the League of Nations or the United Nations. Overall, given that I am focusing on wars between members of the state system, the population of members of the interstate system is the relevant comparison.
To create a dataset for battle deaths over time, I first combine the casualties of all wars that began in the same year. I then divide this by the state system population (in millions) for that year. This creates a dataset with a unit of analysis of the year. Dependent variables are based off the total number of deaths per million people for wars that began in that year. In my analyses, I then compare these DVs to time.
This data format alleviates two problems with other potential data formats. First, previous analyses have assigned deaths to the actual year in which they occurred (for multi-year wars), rather than assign all deaths to the start year of the war. However, as most deaths occur in longer, more intense wars, this creates problems of autocorrelation, where the number of deaths in a given year is often closely correlated to the number of deaths in the year before or after. This correlation is unrelated to any overall trend in war but can make it appear that there is a more consistent trend in deaths than there actually is. By assigning all battle deaths to the start year of the war, I have eliminated the main problem of autocorrelation. It is possible that the start dates of wars are themselves correlated, which would present similar issues. However, this form of autocorrelation is significantly less severe than the year to year correlation of deaths within wars.
An overview of the data can be seen in the first figure above and in Table 1 below. The figure uses a seven-year moving average, according to the following formula: moving average for yeary = (deathsy + .75 deathsy-1 + .75 deathsy+1 + .5 deathsy-2 + .5 deathsy+2 + .25 deathsy-3 + .25 deathsy+3)/4. As can be seen, in most years, there are no war onsets, and the deadliest wars are very rare. In addition, it can already be seen that peace was more common prior to World War I. While the frequency of the deadliest wars appears somewhat lower, the frequency of small and moderate size wars has increased.
| Overall | Pre-1914 | 1914-1945 | Post 1945 | |
|---|---|---|---|---|
| No war |
114 |
65 |
19 |
36 |
| 0-1 deaths/mil |
16 |
2 |
2 |
6 |
| 1-10 deaths/mil |
32 |
13 |
3 |
16 |
| 10-100 deaths/mil |
17 |
12 |
4 |
1 |
| 100-1000 deaths/mil |
11 |
6 |
2 |
3 |
| >1000 deaths/mil |
2 |
0 |
2 |
0 |
Methods
To statistically analyze the data, I first run a linear ordinary least squares (OLS) regression of the logged (base 10) number of battle deaths per million people against time, with the year being the independent variable. Logging the data is necessary to account for the “power law” nature of conflicts. As noted by many scholars, such as Steven Pinker, and confirmed by Clauset, wars seem to follow a power law where the deadliest conflicts kill far more people than less deadly conflicts. Within my dataset, World War I and II together make up about 79% of the deaths on a population basis. Failing to account for the power law would mean that the timing of these conflicts would overwhelm any other trend, creating misleading results. Logging the data is a standard method for accounting for this type of skewed data and is particularly relevant for variables that follow a power law. For similar reasons, the first and second figures in the main post are displayed on a logarithmic scale.
To allow years zero deaths (which when logged would become negative infinity) to be included, I add 0.01 deaths per million before logging the data. This represents approximately 2 “unrecorded” battle deaths at the beginning of the period, and about 60 near the end. As a robustness check, I also ran models where I add 0.1 deaths and 0.001 deaths, which produce consistent results.
In addition to the base OLS model for the entire time period, I run two additional models to account for possible structural breaks. First, I include a dummy variable, interacted with year, for years following the end of World War II. This allows for a different trend after 1945 than in the years prior. The creation of the UN, beginning of the Cold War, and abhorrence at the severity of World War II among other factors could all have led to a change in the trend at this point. For completeness, a third model includes a similar dummy variable interaction for the years between 1914 and 1945 (in addition to the post-1945 variable). It is possible that World War I could have created similar changes to the end of World War II.
As a second cut at the data, I divide the battle deaths for each year into six severity categories: no war, wars killing between 0 and 1 person per million people, between 1 and 10 people, between 10 and 100, between 100 and 1000, and wars that kill more than 1000 people/million. This creates a second DV of the severity category for wars begun in a given year, which is analyzed using ordered logit models. I again run the same three basic model specifications: an overall trend, one accounting for a break at 1945, and one accounting for breaks at both 1914 and 1945. Dividing the wars into categories loses some information on the precise number of battle deaths but imposes fewer assumptions about the data. In particular, running an OLS model on the logged number of battle deaths assumes that this value is normally distributed around some base trend (i.e. the errors are normally distributed). In contrast, an ordered logit model on the severity codes makes fewer assumptions about the relative frequency of the different categories.
OLS Results
Table 2 below presents the statistical results of the OLS models. The dependent variable in each model is the Log(base 10) of battle deaths / million + 0.01.
| Model 1 | Model 2 | Model 3 | |
|---|---|---|---|
| Year |
0.003 |
0.008 |
0.013 |
| Interwar |
37.804 |
||
| Post-1945 |
33.823 |
42.549 |
|
| Year*interwar |
-0.020 |
||
| Year*post1945 |
-0.017 |
-0.022 |
|
| Constant |
-6.357 |
-16.617 |
-25.343 |
| R-squared | 0.010 | 0.031 | 0.038 |
| Adjusted R-squared | 0.005 | 0.015 | 0.018 |
| N | 192 | 192 | 192 |
+p<0.1,*p<0.05,**p<0.01,***p<0.001
Standard errors in parentheses
Contrary to previous assessments, the coefficient on “year” in model 1, which represents the overall trend, is slightly positive, although it is small and statistically insignificant. This means that when the data on war deaths is considered as a whole, there is no evidence of any decline. While there may be a slight increase, the fact that the coefficient is small and insignificant leads me to believe that there is little evidence of any trend in the overall probability of war deaths.
When accounting for possible structural breaks, there is some evidence of changes in the probability of war, although this appears to be primarily cyclical. In model 2, the coefficient on the interaction term is negative, meaning that logged deaths per million were declining at about 0.009 per year after 1945. However, this is matched by an increasing rate of logged war deaths of .008 per year prior to 1945. There are similar results in model 3, with logged war deaths decreasing by .009 per year after 1945 but increasing by .013 per year before 1914. Thus, while the likelihood of dying in war may be declining since World War II, it was increasing earlier in history. The graph of predicted values in the core post are the predicted values from model 3.
Ordered Logit results
Table 3 below shows the statistical results from the Ordered Logit models of the severity codes.
| Model 4 | Model 5 | Model 6 | |
|---|---|---|---|
| Year |
0.005 |
0.012 |
0.020 |
| Interwar |
72.742 (0.002)*** |
||
| Post-1945 |
38.478 |
51.163 |
|
| Year*interwar |
-0.038 |
||
| Year*post1945 |
-0.020 |
-0.02684 |
|
| 0|1 |
9.440 |
22.910 |
38.791 |
| 1|2 |
9.810 |
23.282 |
39.166 |
| 2|3 |
10.755 |
24.239 |
40.133 |
| 3|4 |
11.684 |
25.179 |
41.077 |
| 4|5 |
13.614 |
27.116 |
43.012 |
| Residual deviance |
473.194 |
469.588 | 467.223 |
| AIC |
485.194 |
485.588 | 487.223 |
| N | 192 | 192 | 192 |
+p<0.1,*p<0.05,**p<0.01,***p<0.001
Standard errors in parentheses
The overall results are similar to the OLS models. Model 4 displays a slight increase over the entire time period. Model 5 and 6 show increasing war severity before 1945 and 1914 respectively, matched with decreasing severity after 1945. The plot in the paper shows predicted probabilities of war derived from model 6. These are generated through Zelig simulations in R over the entire time period. I ran separate simulations for each time period – one between 1816 and 1913 with both dummy variables set to 0, a second between 1914 and 1945 with the interwar dummy set to 1 and the post-1945 set to 0, and a third between 1946 and 2007 with the interwar dummy set to 0 and the post-1945 dummy set to 1. The simulation results are combined into the single graph in the blog post.
Robustness checks
I ran a few robustness checks to see if the apparent results are driven by odd features in the data. These robustness checks provide similar results.
First, as noted above, I experimented with adding different values to the data before logging it in the OLS models. While it is accepted that it is necessary to add a “small” number to the data to allow for the possibility that observations had an initial value of zero, there is less guidance on what number to add. Adding too small a value will create a larger distance between the zero values and the rest of the data, perhaps allowing peace years undue influence. Adding too large a value will collapse differences across the range of values, washing out any results. I thus, ran the results while adding .001, .01, and .1 to the data before logging. The middle value is reported above, but the others give very similar results.
Second, a common practice in time series data is to add a lagged dependent variable as an independent variable to help account for autocorrelation. As I discussed above, the grouping of all battle deaths for a war into the initial year of the war takes care of the primary form of autocorrelation. While there may be a relationship between war starts, it is unlikely that this is as severe or as simple as the relationship between battle deaths within a war. Wars may make additional wars more or less likely, but this is unlikely to be as simple as the next year having a higher probability of war. Thus, in the primary models, I have chosen to include no additional controls for time-dependence between wars. However, as a robustness check, tables 4 and 5 show the results with an additional independent dummy variable indicating whether there was a war in the previous year. I also ran the OLS models (not shown) with a lag DV of the logged battle deaths / million in the previous year, in case more severe wars increase the relationship between wars. As can be seen, including these additional controls for autocorrelation produce virtually no changes in the statistical results.
Table 4: OLS with variable for war in previous year
DV – log(battle deaths / million)
| Model 7 | Model 8 | Model 9 | |
|---|---|---|---|
| Year |
0.003 |
0.008 |
0.013 |
| Interwar |
37.105 |
||
| Post-1945 |
33.108 |
41.825 |
|
| Year*interwar |
-0.019 |
||
| Year*post1945 |
-0.017 |
-0.022 |
|
| War prior year |
0.080 |
0.043 |
0.019 |
| Constant |
-5.799 |
-15.976 |
-24.653 |
| R-squared | 0.010 | 0.029 | 0.036 |
| Adjusted R-squared | -0.001 | 0.008 | 0.004 |
| N | 191 | 191 | 191 |
+p<0.1,*p<0.05,**p<0.01,***p<0.001
Standard errors in parentheses
| Model 10 | Model 11 | Model 12 | |
|---|---|---|---|
| Year |
0.004 |
0.012 |
0.020 |
| Interwar |
60.335 |
||
| Post-1945 |
38.653 |
53.401 |
|
| Year*interwar |
-0.032 |
||
| Year*post1945 |
-0.020 |
-0.028 |
|
| War previous year |
0.082 |
0.034 |
0.005 |
| 0|1 |
8.800 |
22.177 |
38.338 |
| 1|2 |
9.171 |
22.550 |
38.715 |
| 2|3 |
10.116 |
23.507 |
39.681 |
| 3|4 |
11.046 |
24.447 |
40.626 |
| 4|5 |
12.977 |
26.385 |
42.561 |
| Residual deviance | 472.402 | 469.073 | 466.767 |
| AIC | 486.402 | 487.073 | 488.767 |
| N | 191 | 191 | 191 |
+p<0.1,*p<0.05,**p<0.01,***p<0.001
Standard errors in parentheses
Third, even after logging the data, it is possible that the World Wars exert a disproportionate influence on the results. I thus ran both the OLS and the ordered logit models dropping 1914 and 1939 from the dataset. The results are essentially the same as reported above. The results are in tables 6 and 7 below.
| Model 13 | Model 14 | Model 15 | |
|---|---|---|---|
| Year |
0.003 (0.002) |
0.006 (0.004)+ |
0.013 (0.005)* |
| Interwar |
17.901 (60.250) |
||
| Post-1945 |
29.567 (22.240) |
42.549 (23.400)+ |
|
| Year*interwar |
-0.010 (0.031) |
||
| Year*post1945 |
-0.015 (0.011) |
-0.022 (0.012)+ |
|
| Constant |
-5.938 (3.768) |
-12.361 (6.726)+ |
-25.343 (10.035)* |
| R-squared | 0.010 | 0.022 | 0.037 |
| Adjusted R-squared | 0.004 | 0.006 | 0.011 |
| N | 190 | 190 | 190 |
+p<0.1,*p<0.05,**p<0.01,***p<0.001
Standard errors in parentheses
| Model 16 | Model 17 | Model 18 | |
|---|---|---|---|
| Year |
0.005 |
0.010 |
0.020 |
| Interwar |
10.772 |
||
| Post-1945 |
31.710 |
50.776 |
|
| Year*interwar |
-0.00618 |
||
| Year*post1945 |
-0.016 |
-0.027 |
|
| War previous year |
0.082 |
0.034 |
0.005 |
| 0|1 |
9.316 |
19.044 |
38.245 |
| 1|2 |
9.693 |
19.423 |
38.630 |
| 2|3 |
10.675 |
20.412 |
39.633 |
| 3|4 |
11.702 |
21.446 |
40.673 |
| Residual deviance | 451.115 | 448.761 | 445.023 |
| AIC | 461.115 |
462.761 |
463.025 |
| N | 190 | 190 | 190 |
+p<0.1,*p<0.05,**p<0.01,***p<0.001
Standard errors in parentheses
Finally, the cutoff of 1,000 battle deaths for CoW to count a conflict as a war may have different meanings at different periods in time. When the average country population is relatively small, 1,000 battle deaths represents a more intense conflict than for a period when the population is relatively large. Thus, this cutoff may be excluding conflicts early in the period that are included in the data later on. The CoW data thus may undercount deaths early in the period relative to later, perhaps biasing the results. It would thus be desirable to have a common cutoff of war size relative to the typical country size. To do this, I create a new variable recoding a year as having 0 battle deaths if the number of battle deaths divided by the mean country population is less than 1,000/11,000,000. I similarly create a variable recoding a year as 0 deaths if the number of deaths divided by the median country size is less than 1,000/4,000,000. The 11,000,000 and 4,000,000 numbers represent slightly above the mean and median state population in the year of the first recorded war. The new variables thus preserve all wars early in the data but may recode wars later in the sample as having no deaths. Overall, relying on the mean country population recodes 15 years that CoW records a war for as experiencing no battle deaths. Relying on the median cutoff recodes 8 years as experiencing no battle deaths.
In both cases, I compare the war sizes to the mean and median country population rather than the overall system population. Because most wars are bilateral, the relevant comparison is the size of each country. As the system population also includes the number of countries, comparing to the system population would dramatically overstate the degree to which the CoW cutoff of 1,000 battle deaths would have different meanings in different time periods. Tables 8 through 11 below show the results, which are consistent with the previous findings.
| Model 19 | Model 20 | Model 21 | |
|---|---|---|---|
| Year |
0.002 |
0.006 |
0.010 |
| Interwar |
45.353 |
||
| Post-1945 |
18.461 |
24.570 |
|
| Year*interwar |
-0.024 |
||
| Year*post1945 |
-0.010 |
-0.013 |
|
| Constant |
-5.294 |
-12.760 |
-18.869 |
| R-squared | 0.006 | 0.016 | 0.020 |
| Adjusted R-squared | 0.001 | -0.0002 | -0.006 |
| N | 192 | 192 | 192 |
+p<0.1,*p<0.05,**p<0.01,***p<0.001
Standard errors in parentheses
| Model 22 | Model 23 | Model 24 | |
|---|---|---|---|
| Year |
0.004 |
0.009 |
0.019 |
| Interwar |
73.531 |
||
| Post-1945 |
31.165 |
45.782 |
|
| Year*interwar |
-0.039 |
||
| Year*post1945 |
-0.016 |
-0.024 |
|
| 0|1 |
8.771 |
17.707 |
36.000 |
| 1|2 |
8.919 |
17.856 |
36.151 |
| 2|3 |
9.745 |
18.688 |
36.992 |
| 3|4 |
10.675 |
19.619 |
37.936 |
| 4|5 |
12.605 |
21.553 |
39.871 |
| Residual deviance | 411.245 |
410.229 |
408.726 |
| AIC |
423.245 |
426.229 |
428.726 |
| N | 192 | 192 | 192 |
+p<0.1,*p<0.05,**p<0.01,***p<0.001
Standard errors in parentheses
| Model 25 | Model 26 | Model 27 | |
|---|---|---|---|
| Year |
0.002 |
0.007 |
0.010 |
| Interwar |
34.681 |
||
| Post-1945 |
23.767 |
30.701 |
|
| Year*interwar |
-0.018 |
||
| Year*post1945 |
-0.012 |
-0.016 |
|
| Constant |
-5.600 |
-13.584 |
-20.518 |
| R-squared | 0.007 | 0.019 | 0.024 |
| Adjusted R-squared | 0.002 | 0.003 | -0.003 |
| N | 192 | 192 | 192 |
+p<0.1,*p<0.05,**p<0.01,***p<0.001
Standard errors in parentheses
| Model 28 | Model 29 | Model 30 | |
|---|---|---|---|
| Year |
0.004 |
0.011 |
0.0190 |
| Interwar |
72.828 |
||
| Post-1945 |
36.377 |
48.450 |
|
| Year*interwar |
-0.038 |
||
| Year*post1945 |
-0.019 |
-0.025 |
|
| 0|1 |
8.649 |
21.127 |
36.146 |
| 1|2 |
8.862 |
21.340 |
36.362 |
| 2|3 |
9.784 |
22.273 |
37.303 |
| 3|4 |
10.714 |
23.215 |
38.246 |
| 4|5 |
12.644 |
25.153 |
40.181 |
| Residual deviance | 439.753 |
438.166 |
436.597 |
| AIC |
451.753 |
454.166 |
456.597 |
| N | 192 | 192 | 192 |
+p<0.1,*p<0.05,**p<0.01,***p<0.001
Standard errors in parentheses
Summary
As can be seen, the data provides little evidence that there has been a clear and consistent decline of war. Over the entire time-period, the predicted war deaths barely changes, and if anything slightly increases. While there may be a decline in war following World War II, this would be matched by an increase in war deaths prior to World War I. Thus, there is no statistical reason to believe that the recent relatively peaceful period represents a longer trend.