
* The article was originally published on ONN's Datayo platform.
The field of election forecasting has become immensely popular in recent years, becoming so ubiquitous that some studies have argued election forecasts themselves can influence voters’ perceptions and behavior in elections.
While there is some criticism that election forecasting can contribute to a "horse race" view of political processes, these tools can be extremely valuable for a variety of users.
This is because, to state the obvious, elections are important.
Whether an incumbent wins an election or not can have enormous impact on a given country's political trajectory, potentially affecting political stability, security and economic policy, democratization, and many other areas.
This is even true in illiberal democracies and functional autocracies.
Consider the 2013 election of Iranian president Hassan Rouhani, whose openness to nuclear negotiations greatly contributed to the adoption of the Joint Comprehensive Plan of Action (JCPOA). One can also look to the continued electoral success of the Law and Justice Party (PiS) in Poland as a driver of the country's democratic decline and growing estrangement from the European Union.
Indeed, there are an almost innumerable list of elections which have dramatically impacted countries' political trajectories ranging from the United Kingdom's December 2019 snap election which maintained a Conservative Party majority and facilitated the country's exit from the EU to Algeria's 1991 election which resulted in a coup followed by roughly a decade of civil war.
However, much public election forecasting is limited in breadth, both by focus and a reliance on polling data as a primary input.
The forecasting tool introduced here aims to provide an initial attempt to complement these country focused forecasts by providing a global forecast on the probability of incumbent victory based on monthly structural indicators that are updated every month.
Our Data
The data used in our forecast is drawn from the Rulers, Elections and Irregular Governance (REIGN) dataset which contains information on political systems, elections, leader characteristics and coup events for over 200 countries in a leader-month format from 1950 to the present. Also included in our analysis are several economic indicators derived from the International Monetary Fund, the World Bank, as well as weather data from the National Oceanic and Atmospheric Administration.
The indicators included in our model are described in the table below.
They can be grouped into information about the country's elections, leaders, political system, socio-economic conditions, as well as regional indicators based on aggregate trends.
As referenced above, this combination of data amounts to a comprehensive look at the structural factors that may affect incumbent electoral performance.

Beyond the indicators that are included, also notable is that our grouping of roughly 200 countries includes both democracies and non-democracies.
While this may seem somewhat counterintuitive since non-democratic elections are by their very definition not completely free and fair, they are important to include for several reasons.
The first reason is that even non-democratic elections can reveal information about public and elite support for incumbents, which is politically consequential. [1] If autocrats know they cannot count on mass public support they may commit electoral fraud to cover up this fact, which, if it is sufficiently brazen, can lead to mass protest against the government.
Second, poor electoral performance by autocrats can be viewed by rival elements in the regime as a signal of popular dissatisfaction with the incumbent, granting them confidence that the public would support a coup d'état.
Finally, elections in autocracies can end in victory for the opposition and result in political change.
Mexico's 2000 election which ended the Institutional Revolutionary Party's 71 years of one-party rule and the Philippine's 1986 election which handed defeat to longtime autocrat Ferdinand Marcos are two notable examples of this occurrence.
Because elections can influence autocratic leaders, including these elections can help obtain a sense of an autocrat's structural electoral vulnerability and help inform how we think about the country's political trajectory.
We treat elections as a feature of modern government that can exist within a continuum of democracy and non-democracy instead of treating these are distinct categories. This approach allows our models to gain leverage on how structural factors may shape incumbent victory prospects in a more holistic framework across the many different kinds of election-government dynamics that manifest in modern human history.
Another feature of our data concerns the variety of electoral systems included in this analysis, many of which introduce difficulty when it comes to assigning incumbent victory or even precisely who the incumbent is.
Switzerland is a case in point.
While the country clearly has a parliamentary system, its head of government is technically a body of seven people called the Federal Council.
While there exists a president of the Federal Council who is elected every year by the parliament, this individual is considered "first among equals" and does not have substantially greater powers than other members. The parliament indirectly elects every member of the cabinet, meaning multiple parties are represented, but the cabinet members collectively make up the whole head of government.
Who then is the incumbent and how do we judge if said incumbent has "won" the election?
Though imperfect, our answer is the party which obtains the greatest number of seats in the Federal Assembly, as this representation grants the party the greatest influence over which parties make it to the Federal Council.
Semi-presidential systems also offer some challenges, especially in cases where the division of power between head of government and state is not easily ascertained.
Micro-states also often have idiosyncrasies that can introduce confusion.
San Marino, for example, has two heads of state at a time, while the Federated States of Micronesia has a system for indirectly electing presidents that is broadly similar to that of South Africa. Though its president has limited powers in comparison to the legislature meaning it is better thought of as a parliamentary system.
Our Methodology
For initial project development, we chose to adopt a linear stacking algorithm that combines the predictions of multiple models. As an initial stab we combined predictions from the versatile random forest algorithm and a support vector machine. The general goal of such an approach is to draw from the strengths of both models and obtain a better accuracy than would be achieved each model in isolation.
Both models are trained on an initial set of training data and are then used to make predictions on an additional set of validation data. The resulting predictions are then treated as predictors themselves and used to train a generalized linear model that we then use to make predictions on a final testing set of data.
The random forest and support vector machine both have parameters that are selected via cross validation. However, because of the temporal structure of our data we use a rolling origin cross validation technique that moves temporally through the data to ensure that we do not use future observations to predict past ones.
Results
Turning to our testing performance, we achieve an overall accuracy of 69.58%, which is a decent performance given our reliance on structural predictors. The ROC chart for our model’s performance is given below. As a general matter, the more a ROC curve hugs the upper left corner of the graph the better.
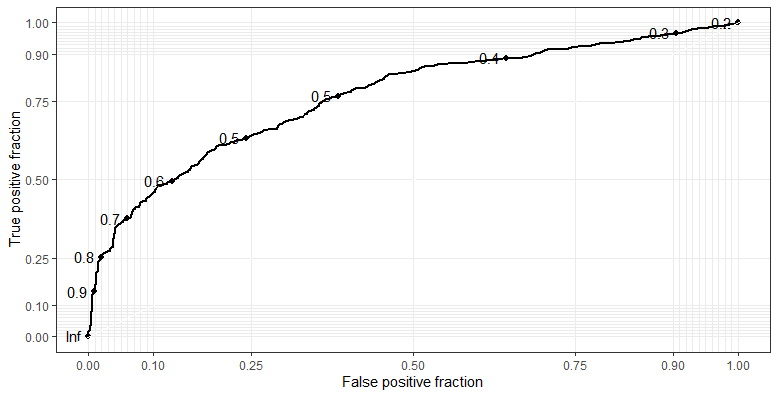
This performance on out-of-sample data lets us know that we have a model that can perform reasonably well on new data, although not perfectly. Our model is much better at correctly classifying victories than it is defeats, meaning that it tends to incorrectly predict that instances of incumbent defeat will be victories, thus dragging the overall accuracy of the model down.
Keeping this in mind, it is useful to examine which variables are contributing most to predictive accuracy. We thus calculate variable importance measures which are an aggregation of the predictive improvement each measure contributes to the forecast when compared to statistical noise .
Below we display the ten most important variables.
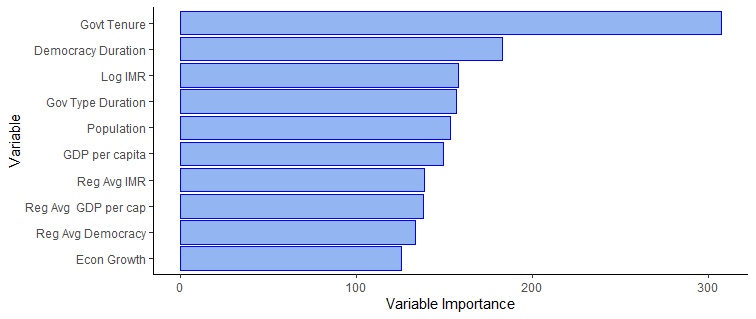
By far our most important predictor is what we call "Govt tenure", which is a combination of our leader and regime tenure variables made through principal components analysis. However, we have a mix of all our categories of variables represented here.
This is intuitive as we would expect each of our categories to have a significant impact on the probability of incumbent victory.
Moreover, that the tenure of the incumbent leader/party would be an important predictor is obvious.
Most leaders and regimes do not stay in office forever, even in non-democracies, which makes their time in office a countdown until they leave office.
We can also get a sense of the directional relationships between incumbent victory and our various predictors by creating partial dependence plots that visualize the controlled relationship of a predictor variable with the target variable.
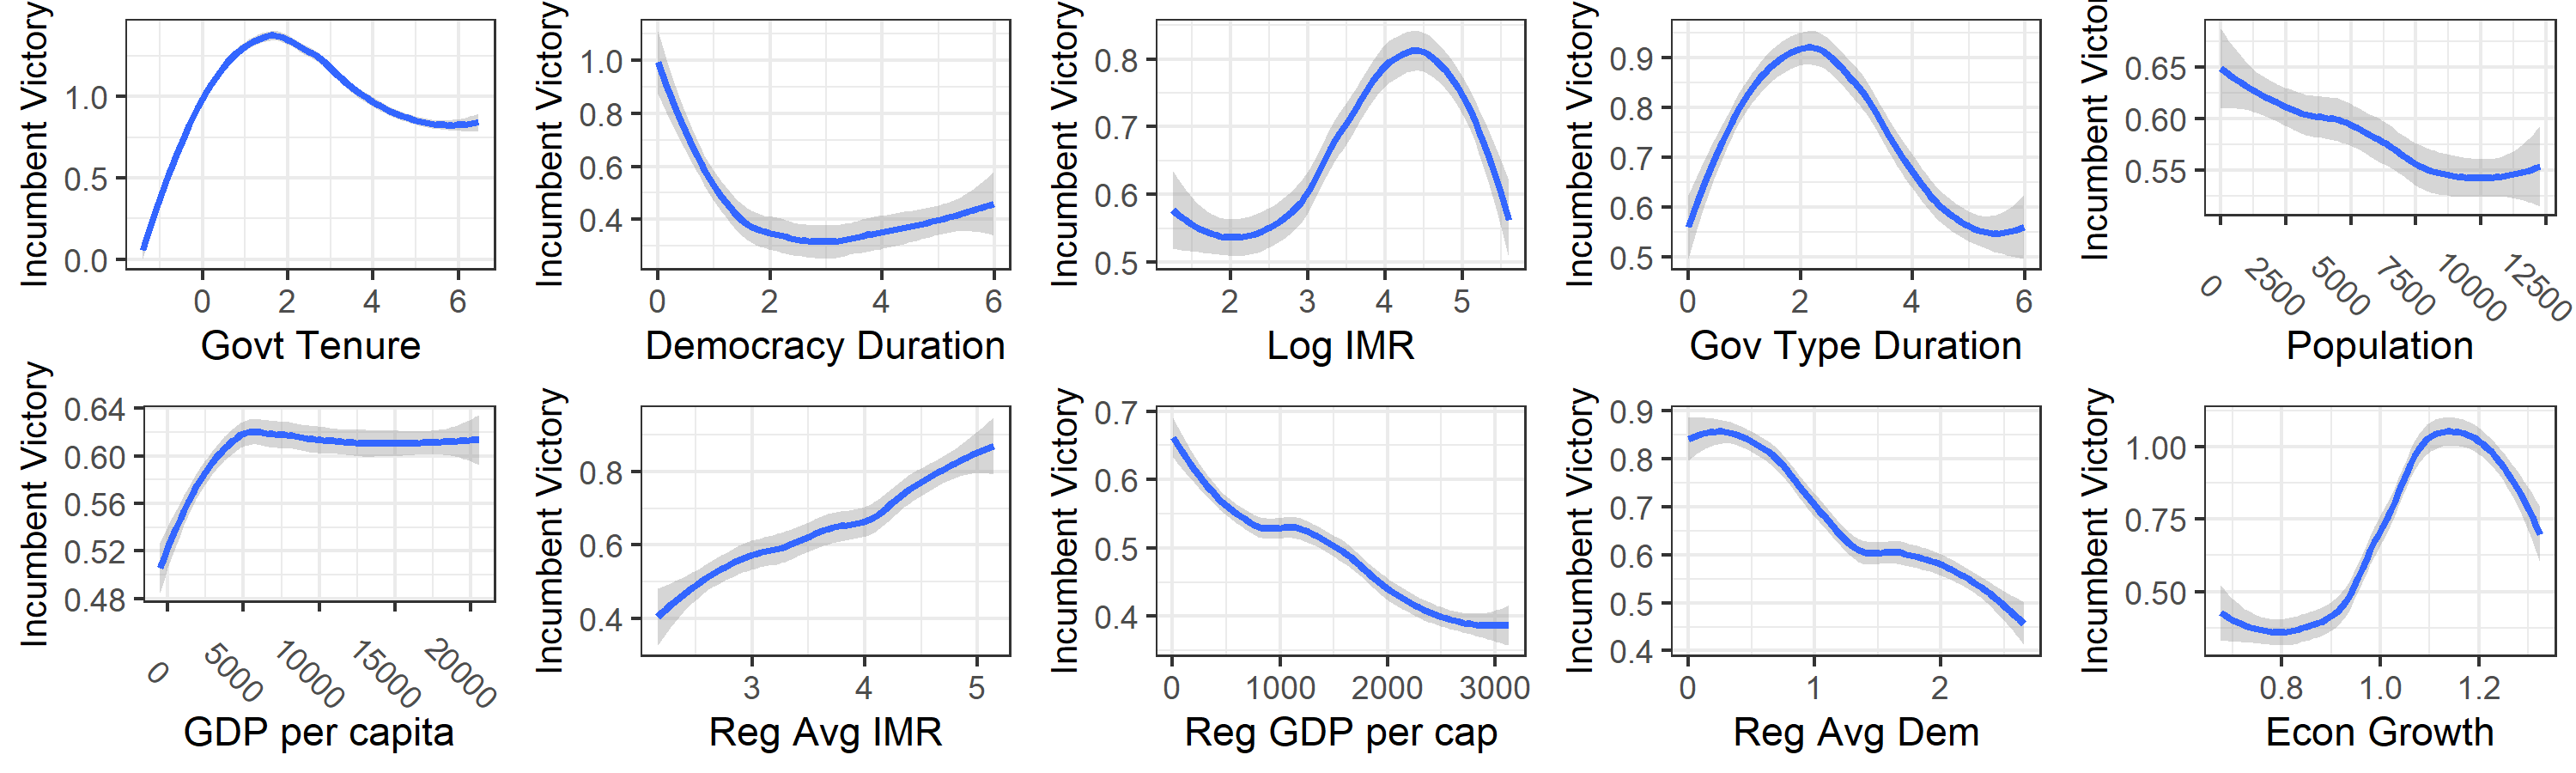
There are several interesting relationships captured here, such as the divergence between country GDP per capita and regional GDP per capita.
The former has an almost logarithmic shape while the latter has a negative linear relationship. At the country level, this suggests that a larger economy can help an incumbent, although diminishing returns are quickly reached. At the regional level, it is possible this average GDP per capita measurement is reflecting the electoral patterns of Europe and North America where there are established democracies that have regular turnover.
In a similar fashion, the relationship between regional average IMR may reflect a concurrence between autocracy and lower socio-economic development.
Concluding Remarks
The results of our model outlined above not only provide interesting insights into the determinants of incumbent victory but also describe a tool which can provide useful forecasted estimates of an incumbent’s probability of victory.
These forecasts can be broadly useful and help inform a variety of political and economic analysis.
That being said, the model has obvious limitations.
Most immediately evident is that the reliance on larger structural predictors requires that predictions be interpreted in the context of more country-specific factors.
One example of this would be announcement by the incumbent government of broad subsidies or other popular public spending programs in the lead up to elections. Political corruption scandals are, of course, another common occurrence that affects incumbents' political prospects that is not included here.
This speaks more broadly to the need to combine geographic and/or thematic expertise with these types of tools.
Even under ideal conditions there are idiosyncratic issues in political systems and campaigns that are best interpreted by those with deep subject matter expertise.
However, there are still several ways that this tool itself can be improved upon in the future.
The largest improvements would likely come from including more and better data in the forecast, with an obvious next step being the inclusion of data on incumbent vote share or voter turnout. Experimenting with other models within our stacking framework may also yield some improvements in accuracy, though this would likely be more marginal.
Given these limitations, we will continue to make improvements as we move forward with our monthly updates.
With limitations acknowledged though, these results indicate that our initial model development has produced a useful forecasting model for a complex and difficult to predict global political topic.
[1] For a broader discussion of this see: Brownlee, J. (2007). Authoritarianism in an Age of Democratization. Cambridge: Cambridge University Press. doi:10.1017/CBO9780511802348